Matplotlib 是一个用于在 Python
中创建静态、动画和交互式可视化的综合库。Matplotlib
让简单的事情变得简单,也让困难的事情成为可能。
Matplotlib(下面简称 PLT)
涵盖了众多图片类型,想要细致的需要每一种是比较困难和不切实际的。因此有效的学习方法就是以一种常见的图形为基础,学习好
PLT 常见的画图配置选项。
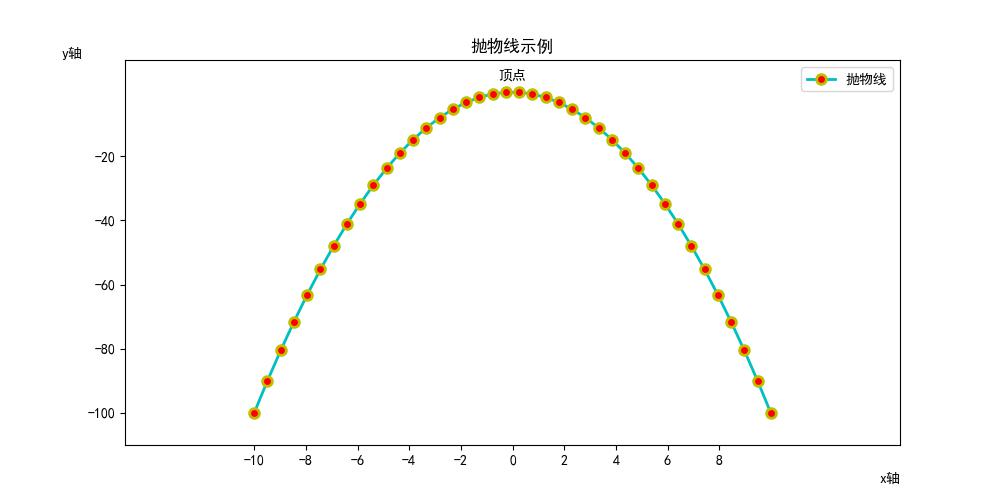
下面以折线图为例,讲解如何利用 PLT 绘制图片。
折线图
PLT 中对于中文的显示存在问题,需要使用如下方式配置显示中文。
1
2
3
4
5
6
7
8
| import matplotlib.pyplot as plt
import numpy as np
from matplotlib.font_manager import FontManager
plt.rcParams['font.sans-serif'] = 'SimHei'
plt.rcParams['axes.unicode_minus'] = False
|
当然,我们也可以查看所有字体。
1
2
3
4
|
fm = FontManager()
my_fonts = set(f.name for f in fm.ttflist)
my_fonts
|
下面开始绘制折线图。
1
2
3
4
5
6
7
8
9
10
11
12
13
14
15
16
17
18
19
20
21
22
23
24
25
26
27
28
29
30
31
|
x = np.linspace(-10, 10, 40)
y = -x ** 2
plt.figure(figsize=(10, 5), dpi=100)
plt.xticks(np.arange(-10, 10, 2))
plt.yticks(np.arange(-100, 0, 20))
plt.xlim(-15, 15)
plt.ylim(-110, 10)
plt.title('抛物线示例')
plt.xlabel('x轴', loc='right')
plt.ylabel('y轴', rotation=0, loc='top')
plt.text(0, 4, '顶点', ha='center')
plt.plot(x, y, c='c', ls='-', lw=2, marker='o', markersize=7, mfc='r', markeredgecolor='y', markeredgewidth=2,
label='抛物线')
plt.legend()
|
 line-chart
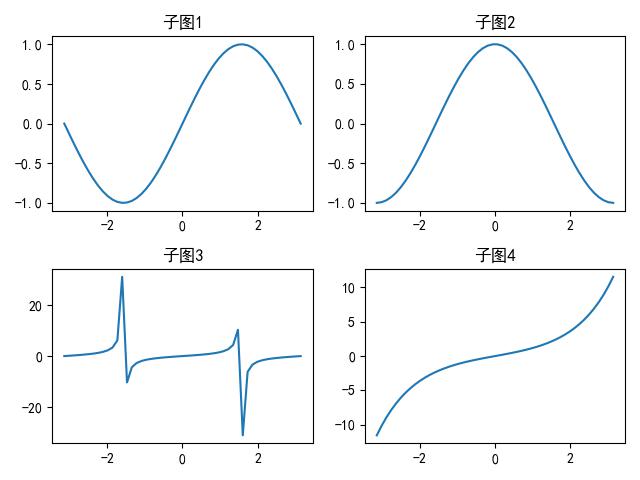
子图多图
下面,我们学习如何在一张图中绘制多个子图。
1
2
3
4
5
6
7
8
9
10
11
12
13
14
15
16
17
18
19
20
21
|
fig = plt.figure()
x = np.linspace(-np.pi, np.pi, 50)
ax1 = plt.subplot(2, 2, 1)
ax1.plot(x, np.sin(x))
ax1.set_title("子图1")
ax2 = plt.subplot(2, 2, 2)
ax2.plot(x, np.cos(x))
ax2.set_title("子图2")
ax3 = plt.subplot(2, 2, 3)
ax3.plot(x, np.tan(x))
ax3.set_title("子图3")
ax4 = plt.subplot(2, 2, 4)
ax4.plot(x, np.sinh(x))
ax4.set_title("子图4")
fig.tight_layout()
|
 subplot1
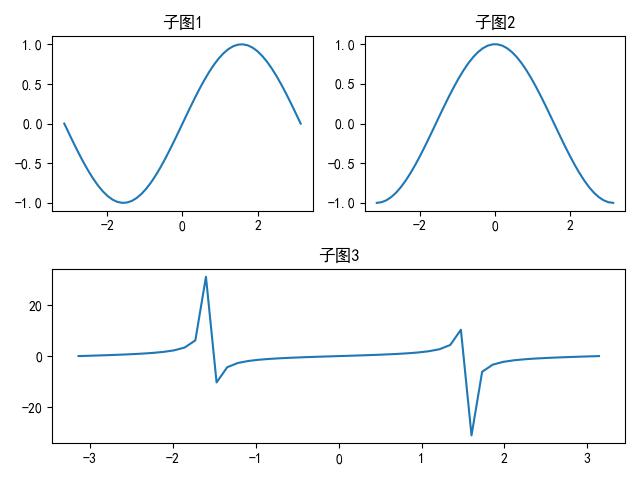
但是,如果我们不想这样规规矩矩的排列图片,我们也可以将某一些列合并。
1
2
3
4
5
6
7
8
9
10
11
12
13
14
15
16
17
|
fig = plt.figure()
x = np.linspace(-np.pi, np.pi, 50)
ax1 = plt.subplot(2, 2, 1)
ax1.plot(x, np.sin(x))
ax1.set_title("子图1")
ax2 = plt.subplot(2, 2, 2)
ax2.plot(x, np.cos(x))
ax2.set_title("子图2")
ax3 = plt.subplot(2, 1, 2)
ax3.plot(x, np.tan(x))
ax3.set_title("子图3")
fig.tight_layout()
|
 subplot2
此外, 还有一种方法是使用 subplots (),
一次性返回所有的子图。在此不做介绍。
如果我们想绘制多图,则只需要每次调用 plt.show()
即可。若不调用,则默认在同一张图中进行绘制。
1
2
3
4
5
6
7
8
|
plt.figure(dpi=50)
x = np.linspace(-5, 5, 50)
plt.plot(x, np.sin(x))
plt.show()
plt.figure(dpi=50)
plt.plot(x, np.cos(x))
|
参考
https://www.bilibili.com/video/BV1nM411m7Cf?t=1.3
https://matplotlib.org/stable/plot_types/index.html